

Key Market Insights
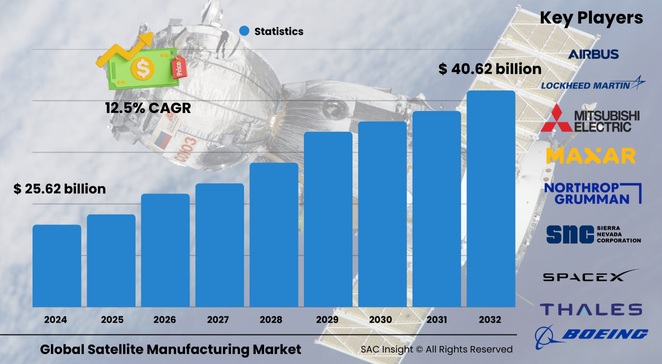
The satellite manufacturing market size stood at roughly US$ 22.52 billion in 2024 (actual) and is estimated to reach about US$ 272.6 billion in 2025 as new production lines ramp up. SAC Insight evaluation projects the industry to advance to nearly USD$ 301.16 billion by 2032, registering a 12.5 % CAGR during the forecast period. First-hand industry insights highlight four structural tailwinds: rapid miniaturization, swelling demand for uninterrupted connectivity, heightened national-security spending, and sustainability-driven design refreshes. The U.S. satellite manufacturing market is set to approach USD$ 267.51 billion by 2032, underpinned by a robust launch cadence and public-private partnerships.
Summery of Market Trends and Drivers
• Small-sat constellations lead market growth as operators pursue global broadband coverage and low-latency links.
• AI-enabled on-board processing, quantum-secure communications, and electric propulsion are redefining payload capability and mission economics.
• Sustainability initiatives—from reusable components to debris-mitigation architectures—are becoming procurement must-haves for both commercial and government buyers.
Key Market Players
The competitive landscape of satellite manufacturing market features established aerospace groups such as Airbus, Boeing, Lockheed Martin, Northrop Grumman, RTX, and Thales alongside disruptors like SpaceX, Dhruva Space, and Gilmour. These companies dictate market share through high-volume production, vertically-integrated supply chains, and aggressive R&D in propulsion, composite structures, and digital engineering. Emerging specialists—including Maxar and Azista BST—add competitive heat with nimble manufacturing models focused on Earth-observation and small-sat platforms.
Key Takeaways
• Market value (2025 estimate): about USD$ 272.6 billion
• Forecast value (2032): nearly USD$ 301.16 billion at a 12.5 % CAGR
• Low Earth Orbit platforms command roughly 64.5 % market share, reflecting the constellation boom
• Communication payloads capture close to 79 % of 2024 revenue
• The 100-500 kg mass class holds about 65 % share thanks to versatile minisatellite designs
• Liquid-fuel propulsion technologies account for roughly 73 % of subsystem spend
Market Dynamics
Drivers
• Rising appetite for real-time imagery, broadband, and IoT connectivity in remote regions
• Increased defense outlays for secure, resilient space-based communications and reconnaissance
• Cost compression via standardized satellite buses and 3-D-printed structures
Restraints
• Limited launch availability and congestion in key orbital planes
• Capital-intensive clean-room and test-facility requirements for newcomers
• Regulatory complexity around export controls and spectrum licensing
Opportunities
• Edge-computing payloads that reduce ground-station bandwidth
• Green propulsion systems (electric and iodine-based) that extend satellite life while cutting fuel mass
• Rapid-manufacture “satellite-as-a-service” models targeting startups and universities
Challenges
• Persistent space-debris threat prompting stricter post-mission disposal rules
• Supply-chain bottlenecks for specialty semiconductors and radiation-hardened components
• Talent shortages in orbital mechanics, RF engineering, and cryogenic propulsion disciplines
Regional Analysis
The satellite manufacturing market in North America leads on the back of hefty governmental budgets and a vibrant commercial launch sector, holding just over 53 % of 2024 revenue. Asia-Pacific is the fastest-growing region (~18 % CAGR) thanks to ambitious national programs in China, India, Japan, and South Korea. Europe maintains technological clout in high-throughput GEO platforms and reusable upper stages, while Latin America and the Middle East & Africa accelerate investment to secure independent space capabilities.
• North America – launch innovation hub; home to 89 % of 2024 U.S. regional share
• Europe – strong in Earth-observation and civil-security missions; ~17 % CAGR projected
• Asia-Pacific – 23 % China share within the region; India growing at ~27 % through 2029
• Latin America – Brazil expands small-sat programs for environmental monitoring
• Middle East & Africa – UAE and Saudi Arabia ramp indigenous manufacturing capacity
Segmentation Analysis
By Orbit
• Low Earth Orbit – ~64.5 % share
Low Earth Orbit satellites dominate because their proximity supports low-latency broadband and high-resolution imaging. Large-scale constellations are trimming unit costs and normalizing near-real-time data delivery.
• Medium Earth Orbit – fastest growth around 12 %
Medium Earth Orbit platforms are thriving in navigation and resilient communications, valued for broader coverage than LEO and lower latency than GEO. Upgrades to global GNSS networks underscore this trajectory.
• Geostationary Orbit – steady niche for broadcast and high-capacity links
Although overshadowed by LEO constellations, GEO birds remain indispensable for television, weather, and secure government channels requiring constant regional coverage.
By Satellite Mass
• 100-500 kg – roughly 65 % share
Minisatellites strike the ideal balance between payload heft and launch cost, handling broadband back-haul, multi-spectral imaging, and in-orbit servicing tasks with modular buses.
• Below 10 kg – fastest at ~13 %
Nanosatellites unlock “deploy-and-forget” sensing and student missions; their low cost fuels experimentation and dense mesh constellations for IoT endpoints.
• Other classes (10-100 kg, 500-1000 kg, >1000 kg) serve specialized missions—from tech demos to heavy-lift military communications—keeping the mass spectrum diverse.
By End User
• Commercial – ~68 % share
Private operators drive bulk demand for broadband, data-relay, and imaging services, backed by venture finance and subscription-based revenue models.
• Military & Government – ~11 % CAGR
Defense agencies invest in hardened satellites for tactical comms, missile-warning, and electronic-warfare resilience, emphasizing sovereign supply chains.
By Application
• Communication – ~79 % share
Bandwidth-hungry streaming, cloud back-haul, and airborne connectivity cement communications as the revenue engine.
• Earth and Space Observation – ~19 % CAGR
Constellations capturing sub-meter imagery, climate metrics, and planetary science data are accelerating under climate and research mandates.
Navigation, R&D, Military Surveillance, and others add mission diversity, supporting everything from precision agriculture to deep-space probes.
By Satellite Subsystem
• Propulsion Hardware & Propellant – ~79 % share
High-thrust liquid engines and emerging green propellants remain mission-critical for orbit raising, station-keeping, and de-orbit maneuvers.
• Satellite Bus & Subsystems – ~18 % CAGR
Standardized, AI-ready buses shorten build cycles and simplify constellation maintenance, aiding small-sat scale-out.
Solar Array & Power Hardware plus Structures, Harness & Mechanisms round out the ecosystem with lighter, more efficient designs that boost payload capacity.
By Propulsion Technology
• Liquid Fuel – ~73 % share
Liquid bipropellants offer precise thrust control and long mission life, keeping them the default for GEO and heavy-lift platforms.
• Electric Propulsion – ~12 % growth
Hall-effect and ion thrusters cut fuel mass dramatically, crucial for small-sat cluster deployments and life-extension programs.
• Gas-based (cold-gas, resistojet) solutions support nanosat maneuvering and attitude control where simplicity outweighs delta-V requirements.
Industry Developments and Instances
• Oct 2024: SpaceX lofted 20 satellites for a newly merged operator, advancing a global LEO communications network.
• Sep 2024: A European prime launched a high-capacity Ku-band GEO satellite on a Falcon 9, extending African and Eurasian broadcast coverage.
• Aug 2024: A joint U.S.–Norwegian broadband pair reached polar orbit, marking the first operational U.S. military payload hosted on an international commercial bus.
• Nov 2023: A leading European OEM secured a contract for a next-generation Ka-band spacecraft targeting mobile back-haul markets.
Facts and Figures
• One top manufacturer now produces around 120 satellites per month, a ten-fold increase over 2019 output.
• More than 4,025 satellites operate in LEO versus 133 in GEO, underscoring orbit diversification.
• Government space spending hit US$ 103 billion in 2021, with the U.S. contributing roughly US$ 62 billion.
• Between 2017-2022, North America placed 580 nanosatellites into orbit; Asia-Pacific launched over 190.
• Propulsion hardware captures about 79 % of subsystem revenue, reflecting mission-life extension priorities.
Analyst Review and Recommendations
Satellite manufacturing is shifting from bespoke engineering to scalable, software-defined production. Vendors that embrace modular buses, AI-enhanced in-orbit autonomy, and green propulsion will outpace peers on cost and compliance. For new entrants, carving out niches in electric-propulsion modules or high-throughput LEO payloads offers the quickest route to market share. Established primes should double down on supply-chain resilience and actively partner with launch providers to lock in manifest slots and safeguard delivery schedules.


