

Market Overview
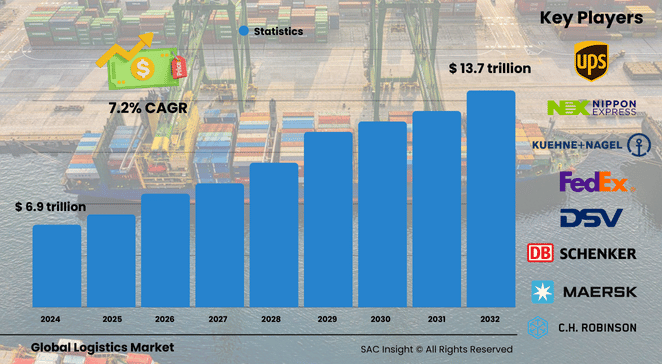
The global logistics market size was approximately US$ 6.997 trillion in 2024 and is projected to reach about US$ 13.736 trillion by 2032, reflecting a steady 7.25% CAGR. SAC Insight evaluation points to three structural drivers: surging e‑commerce volumes that tighten delivery windows, continued investment in smart warehousing and route‑optimization technologies, and a broader shift toward resilient, multi‑modal supply chains able to absorb geopolitical or climate‑driven shocks. First‑hand industry insights also highlight a rebound in cross‑border trade flows as near‑shoring activity picks up in North America and Europe. The U.S. logistics market is on course to top roughly US$ 2.6 trillion by 2032, supported by high consumer spending and ongoing automation of fulfillment hubs.
Summary of Market Trends & Drivers
Rapid growth in direct‑to‑consumer shipping, the mainstreaming of electric and autonomous delivery fleets, and rising demand for supply‑chain visibility tools are reshaping operating models. At the same time, sustainability mandates and carbon‑tracking requirements are nudging providers toward greener assets and data‑rich performance dashboards.
Key Market Players
The global logistics market leading companies include United Parcel Service, FedEx, Deutsche Post Group, A.P. Moller – Maersk, Kuehne + Nagel, DSV, DB Schenker, C.H. Robinson, Nippon Express, and GEODIS. These firms set the competitive pace through heavy investment in automation, AI‑enabled planning suites, and strategic partnerships that blend freight forwarding, contract logistics, and last‑mile capabilities into integrated platforms. Mid‑sized innovators are carving out share by specializing in cross‑border e‑commerce flows, temperature‑controlled networks, and reverse logistics optimization.
Key Takeaways
• Market value in 2024: roughly US$ 6.997 trillion
• Projected value in 2032: around US$ 13.736 trillion at a 7.25% CAGR
• Asia‑Pacific holds the largest regional market share at about 35% and posts the fastest growth trajectory
• Transportation services command 29.5% of 2024 revenue, with roadways accounting for 43.3% of spend
• 3PL/contract logistics models cover 71.4% of market activity, while 4PL solutions deliver the quickest margin expansion
• Retail & e‑commerce contribute 29.5% of demand, validating the shift toward high‑velocity, last‑mile fulfillment networks
Market Dynamics
Drivers
• Explosive e‑commerce penetration and consumer expectations for same‑day or next‑day delivery
• Accelerated deployment of AI, IoT, and robotics that shrink handling times and heighten shipment visibility
• Government investments in freight corridors, ports, and smart border management that reduce transit friction
Restraints
• Fragmented and, in some regions, inadequate transportation infrastructure that inflates costs and risks delays
• Persistent shortage of skilled drivers and warehouse labor, raising wage bills and constraining capacity
Opportunities
• Growth in reverse logistics as returns processing, refurbishment, and recycling gain strategic importance
• Adoption of electric vehicles, alternative fuels, and carbon‑offset programs creating new service niches
Challenges
• Tightening environmental regulations such as maritime emission caps adding compliance complexity
• Cybersecurity threats targeting digitally connected fleets and warehouse control systems
Regional Analysis
The logistics market in Asia‑Pacific dominates thanks to strong manufacturing bases in China, India, and Southeast Asia, massive consumer populations, and aggressive government spending on multimodal infrastructure. North America follows with 23.9% share, buoyed by resilient consumer demand and near‑shoring trends, while Europe logs the second‑fastest CAGR on the back of sustainability investments and cross‑border e‑commerce growth.
• Asia‑Pacific – 35% share; fastest CAGR driven by e‑commerce scale‑up and port modernization
• North America – 23.9% share; automation of fulfillment centers and regionalized supply chains spur growth
• Europe – steady expansion; sustainability mandates and high adoption of digital freight platforms
• Latin America – benefitting from near‑shoring and growing consumer electronics assembly activity
• Middle East & Africa – incremental gains as free‑trade zones and cold‑chain corridors come online
Segmentation Analysis
By Service
• Transportation Services – Largest revenue contributor
Timely, cost‑efficient movement of goods underpins the entire supply chain and continues to attract tech investment in route planning and fleet electrification.
• Warehousing & Distribution – Fastest‑growing sub‑segment
Automation, robotics, and data‑driven slotting strategies make modern warehouses critical nodes for omnichannel fulfillment.
By Category
• Conventional Logistics – 73.9% share
Long‑established networks and expertise handle heavy, bulk, and complex freight where predictability outweighs speed.
• E‑Commerce Logistics – Highest CAGR at 8.2%
Parcel‑centric operations, adaptive last‑mile routing, and omnichannel returns management define this tech‑heavy arena.
By Model
• 3PL/Contract Logistics – 71.4% share
Scalable outsourcing solutions cut fixed costs and deliver end‑to‑end execution for shippers of all sizes.
• 4PL/Lead Logistics – 7.5% CAGR
Acting as a single orchestrator across multiple 3PLs, 4PLs leverage data integration for strategic control and agility.
By Type
• Forward Logistics – 68.3% share
The traditional “factory‑to‑customer” flow remains the backbone of market growth and customer satisfaction.
• Reverse Logistics – Expanding at 6.8% CAGR
Higher return rates and sustainability targets elevate the importance of efficient product take‑back and refurbishment.
By Operation
• Domestic – 73.6% share
Shorter lead times, mature networks, and simplified regulation underpin dominant domestic flows.
• International – Growing at 7.9% CAGR
Globalization of sourcing and rising cross‑border e‑commerce require sophisticated customs and multimodal expertise.
By Mode of Transport
• Roadways – 43.3% share
Flexible, cost‑effective door‑to‑door service supports both first‑mile pick‑ups and last‑mile drops.
• Railways, Airways, Waterways – Rail and air serve high‑value or time‑critical loads; waterways record a 7.5% CAGR as bulk shippers and exporters seek cost and carbon advantages.
By End Use
• Retail & E‑Commerce – 29.5% share
High order velocity and customer‑experience requirements drive investment in last‑mile innovation.
• Manufacturing – Largest single industry user due to just‑in‑time inventories and globally dispersed production lines.
• Consumer Electronics – Fastest‑growing end use at 7.9% CAGR, reflecting frequent product refresh cycles and high return volumes.
Industry Developments & Instances
• April 2025 – Agility Robotics and a warehouse software specialist rolled out bipedal robots to address labor shortages and boost pick‑rates
• April 2025 – A leading automotive supplier appointed a new lead‑logistics partner to manage roughly 100,000 annual transport moves across Europe from a Warsaw control tower
• June 2025 – A global freight giant broke ground on a 23,000 m² e‑commerce hub near Dubai’s Al Maktoum Airport, scheduled for service in 2026
• July 2024 – A Korean 3PL committed US$ 57 million to three U.S. distribution centers to support battery and EV component exports
• May 2024 – A major express carrier launched a one‑stop solution for shipping regulated goods out of Cebu, broadening market access for local exporters
• July 2024 – A multinational logistics firm opened a 145,000 ft² facility in Mexico City to support omnichannel clients and deepen its regional footprint
Facts & Figures
• Road transport handles around 43.3% of global logistics spend
• Transportation services captured 29.5% of total 2024 revenue
• Asia‑Pacific accounts for roughly 35% of worldwide market share
• 3PLs manage 71.4% of outsourced logistics activity
• Retail & e‑commerce generated 29.5% of logistics demand in 2024
• Average daily e‑commerce parcel volume grew 19% year‑on‑year in 2025
• Autonomous or electric vehicles completed more than 12 million delivery kilometers globally in 2025
• Reverse logistics costs can equal up to 12% of total supply‑chain spend for fashion retailers
• Warehousing automation investment climbed 14% in 2025 despite macro‑economic headwinds
Analyst Review & Recommendations
Market analysis confirms that the sector’s trajectory hinges on technology‑led efficiency gains and sustainability performance. Providers that marry data‑rich visibility platforms with green transport assets and agile, multi‑modal networks will capture outsized market growth. Shippers should deepen collaboration with 4PL orchestrators to mitigate risk, while investors should prioritize assets with solid e‑commerce exposure, resilient domestic distribution, and clear decarbonization roadmaps.


