

Market Overview
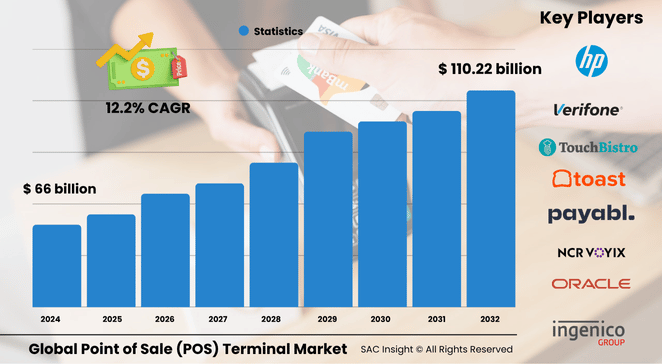
The Global point of sale (POS) terminal market was valued at US$ ≈66 billion in 2024 and is projected to reach at US$ 110.22 billion by 2032, expanding at 12.2% CAGR from 2025-2032. First-hand industry insights point to three structural tailwinds: surging demand for contact-free payments, rapid cloud migration that slashes upfront costs, and steady advances in AI-driven analytics that turn each checkout into a data node. SAC Insight market evaluation also shows volumes fully rebounding from pandemic-era disruptions, with device shipments now well above 2019 levels. The U.S. point of sale (POS) terminal market is forecast to top US$ 17.389 billion by 2032, reflecting brisk upgrades across grocery, quick-service, and fuel retail formats.
Summary of Market Trends & Drivers
• Mobile wallets, tap-to-phone, and QR code payments are shifting hardware mix toward lightweight mPOS and Android-based smart terminals.
• Cloud-native software suites that bundle inventory, loyalty, and AI-powered pricing are becoming the default choice for independent merchants.
• Governments in Asia-Pacific and Latin America are pushing cash-lite policies, accelerating terminal penetration in micro- and small-business segments.
Key Market Players
The report profiles global and regional point of sale (POS) terminal market leaders such as NCR Corp., Oracle, Toast, Block, Ingenico/Worldline, and a rising cohort of API-first challengers specializing in vertical SaaS for restaurants and specialty retail. Together, these firms set the competitive tempo through rapid product refreshes, aggressive subscription pricing, and strategic M&A aimed at folding payment processing into broader merchant-experience platforms. Emerging innovators in software-only “tap-to-pay” and AI-driven fraud detection are also mapped for competitive benchmarking.
Key Takeaways
• Point of sale (POS) terminal indsutry size (2024): ~US$ 66 billion
• Projected value (2032): ~US$ 110.22 billion at a 12.2% CAGR
• Asia-Pacific holds the largest market share (~33.5%) and posts the fastest gains.
• Fixed terminals still dominate revenue, but mPOS logs the highest unit market growth.
• Cloud deployment already accounts for >60% of new installs, up from <30% five years ago.
• AI-assisted dynamic pricing and real-time inventory sync are becoming must-have features in mid-market retail.
Market Dynamics
Drivers
• Explosive adoption of contactless and mobile payments, particularly among Gen Z and small merchants.
• Subscription-based, cloud POS that lowers total cost of ownership and speeds feature roll-outs.
• Government incentives for digital receipts and tax compliance in emerging economies.
Restraints
• Persistent data-security concerns and high-profile breach incidents that dent merchant confidence.
• Fragmented regulatory standards across regions, complicating global roll-outs for vendors.
Opportunities
• AI-powered upsell engines and personalized promotions delivered at checkout.
• SoftPOS (software-only) solutions that convert any NFC-enabled phone into a secure terminal, unlocking the long-tail of micro-businesses.
Challenges
• Intense price competition eroding margins for commodity hardware vendors.
• Short hardware refresh cycles creating e-waste and supply-chain complexity.
Regional Analysis
Asia-Pacific leads both revenue and unit installations in POS terminal market, thanks to pro-cashless policies, booming e-commerce, and domestic manufacturing scale. North America follows, buoyed by contactless adoption and omnichannel retail strategies, while Europe’s growth is anchored by stringent security standards and rapid Android migration.
• Asia-Pacific: Fastest CAGR (~9.5%); China and India drive mPOS roll-outs.
• North America: High per-store spending on analytics-rich software; strong upgrade cycle.
• Europe: Contactless ubiquity and EMV mandates sustain steady replacements.
• Latin America: Digital-wallet boom spurs first-time terminal adoption among SMEs.
• Middle East & Africa: Mobile-money ecosystems and tourism recovery underpin gradual uptake.
Segmentation Analysis
By Product
• Fixed Terminals – Reliability for high-volume lanes.
Large retailers and grocers favour fixed units for durability, integrated scanners, and multi-lane management, keeping this segment above 60% of global revenue.
• Mobile POS – Double-digit CAGR, portability edge.
mPOS lets staff transact anywhere in-store or curb-side, cutting queues and boosting table-turns in restaurants—key to its rapid share gains.
By Component
• Hardware – Core revenue engine.
Cash drawers, scanners, and touchscreen displays remain essential, especially in fixed setups where ruggedness and peripheral density matter.
• Software – Fastest-growing slice.
Cloud-native apps layer inventory, CRM, and AI analytics on top of payment acceptance, creating sticky subscription revenue.
• Services – Integration & support.
Managed services for security patches, compliance audits, and data analytics add recurring value for enterprise clients.
By Deployment
• Cloud – 10%+ CAGR.
Pay-as-you-go models appeal to cost-sensitive SMBs; real-time updates cut maintenance overhead.
• On-premise – Niche but critical.
Chosen by high-volume grocers and petrol chains needing local data control and custom integrations.
By End-User
• Retail (Supermarkets, Convenience, Specialty).
Omnichannel fulfilment and loyalty integration drive terminal upgrades.
• Restaurants (QSR, Casual, Fine-dine).
Tableside ordering and kitchen display sync shorten service times and raise spend per cover.
• Hospitality & Entertainment (Hotels, Cinemas, Casinos).
Unified guest-experience platforms embed POS with room management and ticketing.
• Healthcare & Others.
Pharmacies and clinics adopt terminals to streamline co-pays and patient record linkage.
By Operating System
• Windows/Linux – Familiarity & peripheral support.
Favoured in enterprise roll-outs needing custom drivers and legacy system hooks.
• Android – Leading growth curve.
Open ecosystem slashes hardware cost and speeds app innovation, propelling adoption in emerging markets.
• iOS – Premium niche.
Chosen by boutiques and high-end F&B outlets seeking seamless Apple-Pay integration and sleek form factors.
Industry Developments & Instances
• Jan 2024: A leading connectivity provider unveiled a resilient, cloud-ready platform showcased at NRF, promising “five-nines” uptime for multi-store chains.
• Sep 2023: A cannabis-focused vendor released a scalable POS 2.0 suite with compliance tools for age-restricted goods.
• Jun 2023: A fintech launched an omnichannel terminal that merges online and in-store payments on one device, boosting SMB adoption.
• May 2023: A global handset maker rolled out an Android workstation that bundles inventory, loyalty, and staff-roster modules.
• Mar 2023: A payment giant acquired a SoftPOS specialist, signalling acceleration toward phone-based acceptance.
Facts & Figures
• Contactless transactions accounted for >55% of global in-store card payments in 2024, up from 38% in 2021.
• Cloud deployments represent ≈62% of new POS installs, doubling since 2019.
• AI-driven dynamic pricing tools can lift average basket value by 4-6% for early adopters.
• Average terminal replacement cycle has shortened to 4.5 years, down from 6 years pre-pandemic.
• Asia-Pacific shipped over 25 million units in 2024, nearly half of global volume.
Analyst Review & Recommendations
SAC Insight evaluation confirms the POS terminal market is pivoting from pure payment hardware to data-centric merchant platforms. Vendors that pair sleek Android or SoftPOS form factors with cloud analytics, AI-driven fraud screening, and plug-and-play app marketplaces will outpace slower rivals. For new entrants, mobile-first bundles targeting micro-merchants in Asia and Latin America offer the quickest route to scale, while incumbents should double down on managed security services to offset hardware margin pressure and cement long-term trust.


