

Market Overview
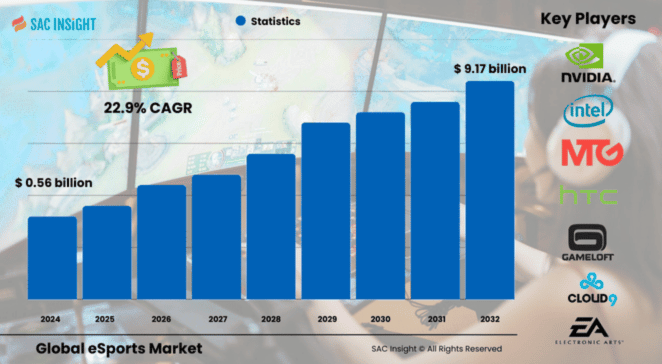
The global esports market size stood at US$ 0.56 billion in 2024 and is projected to soar to approximately US$ 9.17 billion by 2032. This jump reflects an average CAGR of 22.9% for the 2025-2032 forecast window, driven by rising live-stream viewership, aggressive brand sponsorships, and a step-change in professional league infrastructure. The U.S. esports segment alone is expected to approach US$ 2.74 billion by 2032 as colleges, media groups, and tech firms expand varsity programs and city-franchise arenas.
Summary of Market Trends & Drivers
• Live streaming and cloud gaming are pulling casual viewers into persistent fan ecosystems, lifting overall market growth.
• Corporate sponsors and media networks are chasing hard-to-reach Gen Z audiences, pushing rights fees and team valuations higher.
• Hybrid on-site plus virtual tournaments have become the post-pandemic norm, widening global reach while keeping venue revenue intact.
Key Market Players
Global publishers and platform owners dominate the competitive tempo. Activision Blizzard, Tencent, Valve, and Riot Games continually refresh flagship leagues and monetize via season passes, micro-transactions, and global media deals. Hardware and infrastructure specialists such as NVIDIA, Sony, and Intel underpin performance standards, while streaming leaders and tournament operators—Twitch, Gfinity, X1 Esports, Loco, Caffeine, and DLive—fuel audience acquisition with language-localized broadcasts and creator partnerships. A flurry of strategic M&A—ranging from Sony’s tournament-platform buyouts to cloud-service alliances—underscores a rapidly consolidating value chain, yet leaves room for nimble regional players to carve out niche markets.
Key Takeaways
• Current market value (2024): USD$ 0.56 billion
• Projected value (2032): USD$ 9.17 billion at a 22.9% CAGR
• North America retains the highest market share, while Asia-Pacific delivers the fastest incremental viewers and spend
• Sponsorship remains the single largest revenue source, forecast near US$ 3.6 billion by 2032
• Media rights revenues are climbing fastest as platforms vie for exclusive content
• Free-to-play titles with in-game micro-transactions continue to underpin long-term monetization models
Market Dynamics
Drivers
• Explosive growth in mobile and cloud gaming broadens the participant base and raises engagement time
• Large prize pools and athlete-style contracts elevate esports as a viable career, attracting new talent and fans
• Brand advertisers shift budgets toward esports to access digitally native, ad-averse demographics
Restraints
• Player health concerns, ranging from repetitive-strain injuries to screen-time addiction, could trigger stricter governance
• Fragmented regulatory frameworks complicate cross-border league operations and revenue recognition
Opportunities
• 5G rollout and edge compute lower latency, enabling high-fidelity mobile tournaments in emerging markets
• AI-driven highlight clipping and personalized feeds open new monetization layers for rights holders
Challenges
• Maintaining competitive integrity amid match-fixing and cheating scandals
• Rising production costs for top-tier events may squeeze margins for smaller organizers
Regional Analysis
North America currently leads in revenue, buoyed by franchised city leagues, collegiate scholarships, and deep venture funding. Asia-Pacific, however, is the growth engine, combining vast mobile-first audiences with supportive government policies in China, South Korea, and pockets of Southeast Asia. Europe benefits from mature football-club crossovers, while Latin America and the Middle East funnel public and private capital into arena projects to diversify entertainment portfolios.
• North America – Largest revenue pool, driven by franchise models and media rights
• Asia-Pacific – Highest CAGR, powered by mobile gaming penetration and government backing
• Europe – Steady market analysis shows strong publisher-club partnerships and grassroots leagues
• Latin America – Rapid fan-base expansion, supported by affordable data plans and local sponsors
• Middle East & Africa – Government investment accelerates venue builds and regional tournament circuits
Segmentation Analysis
By Streaming Type
• Live – Core engagement engine, dominant share
Real-time chats, influencer co-streams, and interactive overlays keep viewers glued, reinforcing stickiness and driving ad inventory.
• Video-on-demand – Convenience-led, high double-digit growth
Match replays and curated highlights serve time-shifted audiences and unlock incremental sponsorship slots.
By Revenue Source
• Sponsorship – Largest slice (39%) and still expanding
Custom activations—from branded team houses to in-game billboards—allow sponsors to embed deeply without interrupting play.
• Media Rights – Fastest-growing stream
Exclusive multi-language deals with OTT platforms, cable networks, and telcos escalate bidding wars and underpin predictable cash flows.
• Advertising – Audience-scale monetizer
Pre-rolls, mid-rolls, and programmatic banners convert soaring viewer hours into CPM revenue.
• Ticket & Merchandise – Experience-led upside
Limited-edition jerseys, player meet-ups, and premium arena seating re-create traditional sports economics.
• Game Publisher Fees – Stable backbone
Developers underwrite prize pools and production costs to keep titles in the competitive spotlight.
• Others – In-app purchases and virtual goods
Skins, battle passes, and digital collectibles diversify wallet share and foster community identity.
By Gaming Genre
• First Person Shooter – Broadest viewership, evergreen franchises
Fast-paced action and spectator-friendly formats secure year-round league calendars.
• Multiplayer Online Battle Arena – Cross-platform breakout
Deep strategic layers and frequent updates sustain high retention and sponsor visibility.
• Real-Time Strategy – Niche but loyal fanbase
Complex macro-play appeals to analytics-minded viewers and high-skill competitors.
• Fighting Games – Grassroots vitality
Open-bracket formats and local tournaments cultivate community inclusivity.
• Mass Multiplayer Online Role-Playing – Community-centric ecosystems
Persistent worlds and avatar customization enable recurring revenue through expansions and cosmetic items.
• Others – Racing, sports simulators, rhythm games
Specialized circuits cater to genre-specific fans and automotive or lifestyle sponsors.
Industry Developments & Recent Market Developments
• April 2023: A cloud-video specialist acquired an AI clip-creation startup to automate highlight reels for tournament organizers.
• April 2023: A South Asian league operator bought majority control of a live-media company, expanding its global sponsor roster.
• February 2023: A GPU manufacturer partnered with a console-publisher to stream PC titles via a cloud platform, broadening access across devices.
• February 2023: A telecom brand teamed with a matchmaking platform to host nationwide amateur cups, deepening 5G adoption.
• January 2023: A console division collaborated with a women-led enterprise to launch a safe-space tournament series.
• June 2022: A consumer-electronics giant purchased an online tournament platform, bolstering its ecosystem around next-gen consoles.
Facts & Figures
• Sponsorship is set to reach roughly USD$ 3.6 billion by 2032, up from just over USD$ 1.4 billion today.
• Viewers spent nearly 24 billion hours watching esports streams in 2021, a 45% jump year on year.
• North America captured about 32.6% of global revenue in 2024, maintaining its long-held lead despite Asia-Pacific’s faster rises.
• During pandemic disruptions, 53% of scheduled live events shifted online and 8% were cancelled outright, accelerating digital-first models.
• Prize pools for flagship tournaments now top US$ 40 million annually, rivaling mid-tier traditional sports leagues.
Analyst Review & Recommendations
Esports is transitioning from a high-growth curiosity to a structured media property with clear revenue lanes and maturing governance. Teams that couple performance analytics with fan-experience technology will unlock premium sponsorship rates, while rights holders should diversify distribution across OTT, social, and linear channels to hedge platform risk. Investors should monitor emerging mobile-only leagues in Asia-Pacific—they represent the next inflection point for sustained market growth and differentiated market share gains.


