

Market Overview
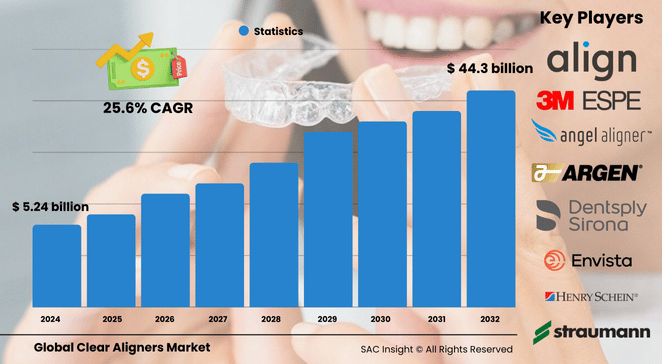
The clear aligners market size was valued at US$ 5.24 billion in 2024 and according to SAC Insight evaluation, is set to climb to about US$ 44.30 billion by 2032. This trajectory represents brisk market growth at an average 25.65% CAGR. First‑hand industry insights point to three structural tailwinds: rising demand for discreet orthodontics among adults, rapid adoption of digital treatment planning and 3D printing, and a surge in direct‑to‑consumer (DTC) offerings that expand access while compressing price points. In the United States—still the single biggest profit pool—the market is projected to reach about US$ 17.57 billion by 2032, supported by higher disposable income and a growing preference for cosmetic dentistry.
Summary of Market Trends & Drivers
• Digital workflows, from intra‑oral scanning to AI‑guided treatment simulation, are shortening chair time and enhancing case acceptance.
• Consumer appetite for aesthetic, removable appliances is accelerating, especially in segments once deterred by metal braces.
• Hybrid sales models that blend in‑office expertise with online convenience are reshaping market share and intensifying competition.
Key Market Players
The global clear aligners market analysis shows that Align Technology continues to anchor the competitive landscape through its extensive Invisalign ecosystem, proprietary scanners, and cloud‑based planning tools. Close followers such as Ormco (Envista), Institut Straumann, Dentsply Sirona, and 3M leverage broad dental portfolios and strong clinician networks to defend share and roll out new polymer chemistries.
Meanwhile, Henry Schein, Angelalign, and an expanding roster of DTC specialists are carving out niches with lower‑cost plans, concierge service models, or region‑specific manufacturing hubs. Collectively these companies sustain an innovation race focused on smarter materials, shorter wear schedules, and seamless doctor‑patient collaboration.
Key Takeaways
• Global revenue (2024): USD$ 5.24 billion
• Projected revenue (2032): USD$ 44.30 billion at a 25.65% CAGR
• North America holds roughly 54% market share, yet Asia Pacific is the fastest‑growing region through 2032.
• Polyurethane dominates material demand at about 76% share thanks to high elasticity and patient comfort.
• Stand‑alone dental practices capture over 52% of revenue, reflecting strong alignment with customized care.
• Offline channels still account for three‑quarters of sales, but online/DTC models are gaining critical mass.
Market Dynamics
Drivers
• Rising prevalence of malocclusion combined with greater aesthetic awareness across adult and teen cohorts
• Advances in 3D printing, CAD/CAM, and hyper‑elastic polymers that improve fit precision and reduce wear time
• Expansion of DTC and hybrid retail models that lower entry costs and broaden treatment access
Restraints
• High out‑of‑pocket expense in many markets and uneven insurance reimbursement
• Limited orthodontic capacity in emerging economies, slowing penetration outside tier‑one cities
• Competition from low‑price DTC kits that bypass chair‑side supervision and may erode clinician confidence
Opportunities
• Night‑time‑only wear systems and shorter treatment protocols that boost adherence
• AI‑driven monitoring apps linking patients and clinicians for mid‑course adjustments
• Untapped demand among adults 35‑55, an age band increasingly prioritizing cosmetic dental interventions
Challenges
• Regulatory scrutiny of remote orthodontics and data privacy surrounding cloud‑based scans
• Raw‑material price volatility for specialty polymers impacting manufacturing costs
• Need for consistent clinical evidence to validate emerging materials and algorithmic treatment planning
Regional Analysis
North America retains clear leadership thanks to high consumer purchasing power, a dense orthodontic workforce, and strong marketing by global brands. Europe follows, supported by aesthetic‑driven culture and well‑developed private‑practice infrastructure, while Asia Pacific delivers double‑digit gains on the back of medical tourism, rising middle‑class incomes, and local manufacturing ramps.
• North America – Large installed base, robust insurance coverage, early tech adoption
• Europe – Heightened focus on facial aesthetics and expanding private dentistry networks
• Asia Pacific – Fastest CAGR; India, China, and Japan drive volume via cost‑effective treatment packages
• Latin America – Growing millennial demand and affordable clinic pricing, especially in Brazil and Mexico
• Middle East & Africa – Gradual uptake tied to premium care clusters in the Gulf states and South Africa
Segmentation Analysis
By Age Group
• Adults – Command just over 59% of revenue and show strong repeat purchase intent. Adults value discreet, removable solutions that mesh with professional lifestyles, pushing suppliers to refine wear schedules and material clarity.
• Teens – Fast‑rising share driven by peer influence and aversion to metal brackets. Teenagers respond to shorter wear times and gamified treatment tracking, creating fertile ground for app‑linked aligner programs.
By Material
• Polyurethane – High elasticity, dominant share. Polyurethane’s strength‑to‑flexibility ratio lets manufacturers craft thinner trays that withstand grinding yet remain comfortable for long wear.
• PETG and other thermoplastics – Emerging alternatives for eco‑friendly or low‑budget lines. PETG offers cost relief and clearer optics, making it attractive for mid‑tier offerings and private‑label DTC brands.
By End‑Use
• Stand‑alone practices – Over 52% share, personalized care hub. Independent dentists and orthodontists embrace digital scanners and chair‑side printers, giving them agility to design custom trays and deepen patient loyalty.
• Group practices and hospitals – Scaling up through integrated digital labs. Larger entities leverage pooled capital to install high‑throughput 3D printers and centralize treatment planning, improving margin per case.
By Distribution Channel
• Offline – Roughly 74% share backed by clinic‑led selling models. In‑office consultations remain the core conversion trigger, particularly for complex cases requiring multiple refinements.
• Online/DTC – Fast‑growing slice, price‑led value proposition. DTC platforms ship impression kits and finished aligners directly to consumers, trimming costs by as much as 60% but raising oversight concerns among regulators.
Industry Developments & Instances
• 2024 – A leading European group received regulatory clearance to mass‑produce aligners in Beijing, strengthening its Asia Pacific supply chain.
• 2024 – OrthoFX introduced night‑time NiTime Aligners in India, reducing daily wear to 9‑12 hours.
• 2023 – SmileDirectClub rolled out an AI‑powered SmileMaker platform in the U.S. for instant 3D scans via smartphone.
• 2023 – Ormco launched Spark Release 14 with cloud‑based case management and seamless scanner integration.
• 2022 – A major incumbent added real‑time visualization links between its intra‑oral scanners and third‑party planning software, accelerating chair‑side approvals.
Facts & Figures
• Polyurethane aligners represented about 76% of global tray shipments in 2024.
• Stand‑alone practitioners handled over half of all clear‑aligner cases worldwide last year.
• Adult adoption rose nearly 37% during the pandemic’s peak years as patients sought remote‑friendly solutions.
• Direct‑to‑consumer options undercut traditional pricing by up to 60%, reshaping customer acquisition costs.
• North America generated roughly 54% market share in 2024, but Asia Pacific logged the highest year‑on‑year growth at more than 30%.
Analyst Review & Recommendations
The clear aligners business is shifting from a device sale to a data‑rich service model. Vendors that fuse proprietary polymers with AI‑enabled remote monitoring and robust clinician support will command premium margins and defend market share. Growth prospects remain strongest in Asia Pacific and among mid‑career adults; however, sustained success will hinge on transparent outcomes data and tighter oversight of DTC pathways. Diversifying material supply and investing in outcome‑tracking apps are recommended strategic priorities for both incumbents and ambitious newcomers.


