

Market Overview
The bubble tea market size stands at US$ 2.63 billion in 2024 and, according to SAC Insight analysis, is projected to hit US$ 4.79 billion by 2032, advancing at a compound annual growth rate (CAGR) of 8.355% over 2020‑2032. First-hand industry insights point to three powerful growth engines: rising demand for low-fat “occasion” drinks among Gen Z, a rapid store-opening cycle outside Asia, and a wave of better-for-you recipes featuring reduced sugar and plant-based creamers. The U.S. bubble tea market is on track to approach US$ 1.9 billion by 2032, reflecting a steady uptick in specialty café traffic and ready-to-drink (RTD) launches.
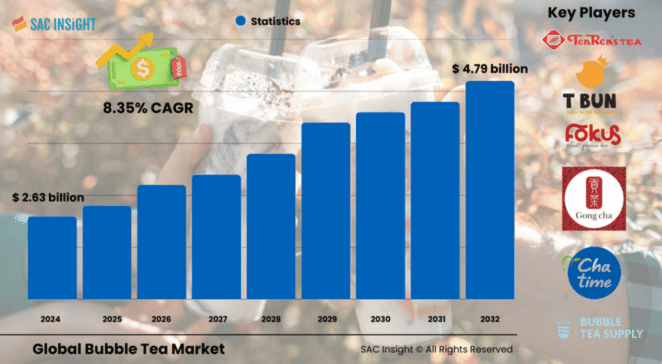
Summary of Market Trends & Drivers
Younger consumers are swapping carbonated sodas for customizable tea-based beverages, pushing market growth into double-digit territory in several cities. Menu innovation—think oat-milk taro, sparkling fruit infusions, and zero-sugar konjac pearls—is widening the addressable audience and lifting same-store sales. Franchises are scaling quickly through cloud kitchens and delivery-first formats, shortening payback periods and boosting investor interest.
Key Market Players
The competitive landscape of the Global bubble tea market report features a blend of regional champions and fast-scaling global brands. Established names such as Gong Cha, Chatime, CoCo Fresh Tea & Juice, and Xing Fu Tang anchor the market with extensive franchise networks and disciplined flavor R&D. Meanwhile, innovators like BUBLUV, MIXUE Group, and Frankly are carving out share with RTD lines, keto-friendly formulations, and aggressive crowdfunding campaigns. Their focus on healthier ingredients and tech-enabled store operations is setting the pace for the next wave of market expansion.
Key Takeaways
• Market value (2024): US$ 2.63 billion
• Projected value (2032): US$ 4.79 billion at an ~8.355% CAGR
• Asia Pacific commands the largest market share at ~43%, but North America is the fastest-growing developed region.
• Black tea remains the dominant base (~43% share), yet green tea is the quickest climber on wellness appeal.
• Fruit flavors lead (~38% share), while taro and chocolate are the fastest-growing niches.
• Store digitalization—QR ordering, loyalty apps, and AI-based demand forecasting—is improving throughput and margins.
Market Dynamics
Drivers
• Strong preference for customizable, Instagram-friendly beverages over traditional carbonated drinks.
• Expanding middle-class spending power in Southeast Asia and Latin America.
• Retailers adding low-calorie, dairy-free, and functional ingredient options to meet health-oriented market trends.
Restraints
• Sugar-content concerns and competing “clean label” caffeinated drinks.
• Supply-chain dependence on tapioca pearls from a limited set of Asian suppliers, raising price-volatility risk.
Opportunities
• RTD bubble tea cans and aseptic cartons targeting supermarkets and convenience stores.
• Lactose-free and plant-based creamers unlocking demand among vegan and lactose-intolerant consumers.
• Franchise white-space in secondary U.S. and European cities with rising Asian diaspora populations.
Challenges
• Tightening food-safety regulations around imported tapioca and flavored syrups.
• Need for consistent quality control as brands scale via multi-unit franchisees.
Regional Analysis
Bubble tea market in Asia Pacific dominates thanks to entrenched tea culture, dense store networks, and social-media-driven fads—Thailand alone averages six cups per person per month. North America follows, buoyed by shifting consumer preferences toward low-alcohol social beverages and a surge in boutique cafés. Europe shows steady uptake, though growth is capped by limited domestic tea supply and higher import costs.
• Asia Pacific: Largest share; innovation hub for flavors and toppings.
• North America: Rapid unit expansion; strong RTD potential.
• Europe: Growing curiosity for exotic tea beverages; crowdfunding supports local chains.
• Latin America: Early-stage adoption; globalization of food trends fuels interest.
• Middle East & Africa: Niche but rising; bubble tea positioned as a premium social drink.
Segmentation Analysis
By Type
• Black Tea – Authentic flavor, antioxidant-rich, majority share.
Black tea keeps its lead by delivering a familiar taste profile and perceived health benefits such as cholesterol reduction. Its robust flavor also pairs well with sweet or creamy inclusions, maintaining broad consumer appeal.
• Green Tea – Wellness halo, fastest CAGR.
Loaded with polyphenols and lower caffeine, green-tea bases are attracting health-minded shoppers. Brands leverage its “clean energy” positioning to justify premium pricing and upsell antioxidant add-ons.
• Oolong & White Tea – Premium niche, experience-driven.
Oolong offers a fragrant, semi-oxidized profile, while white tea’s delicate notes appeal to connoisseurs. Both segments gain traction in specialty cafés where experiential brewing and storytelling matter.
By Flavor
• Fruit – Versatile, ~38% share.
From mango to passionfruit, fruit flavors combine high vitamin content with vibrant colors—perfect for social-media marketing and seasonal limited editions.
• Taro – Creamy texture, breakout star.
Its vanilla-like taste and caffeine-free profile broaden daypart usage, making taro a popular evening indulgence.
• Chocolate & Coffee – Indulgent crossovers.
Chocolate-infused milk teas resonate with all age groups, while coffee-flavored variants attract habitual caffeine users seeking novelty without abandoning their daily ritual.
• Original/Classic & Others – Foundation SKUs.
Classic brown-sugar or “original” milk tea remains the entry point for first-time consumers and a baseline for menu experimentation.
Industry Developments & Instances
• Feb 2024: Gong Cha extends partnership with Mad Vision Group to open 15 new stores across North Africa.
• Jan 2024: MIXUE Group targets a US$ 1 billion Hong Kong IPO to fund overseas expansion.
• Apr 2022: BUBLUV launches a 50-calorie RTD line with tapioca and konjac pearls, tapping keto and gluten-free trends.
• Jun 2022: Italy’s Frankly raises capital via crowdfunding, posting 148% YoY revenue growth to fuel new store rollouts.
Facts & Figures
• ~43% of global sales come from Asia Pacific, with Taiwan exporting bubble-tea ingredients up 330% since 2018.
• Black tea bases account for roughly 43% of revenue, while green tea is growing above 9% annually.
• Average U.S. store ticket value rose 12% in 2024, driven by premium toppings and plant-based add-ons.
• Sugar-reduced SKUs now represent nearly 20% of new product launches.
• Over 65% of Gen Z consumers in Southeast Asia purchase bubble tea at least once a week.
Analyst Review & Recommendations
SAC Insight evaluation suggests the bubble tea category is shifting from novelty to mainstream beverage status. Brands that marry authentic flavors with health-forward tweaks—lower sugar, dairy alternatives, functional add-ins—will capture incremental market share. Prioritize supply-chain resilience for tapioca pearls, invest in RTD technology to unlock retail channels, and deploy data-driven loyalty apps to lift repeat visits. With these strategies, stakeholders can outpace the projected market growth and secure a profitable foothold through 2032.


